pacman :: p_load (jsonlite, tidygraph, ggraph, visNetwork, tidyverse)In-Class Exercise 5
VAST Challenge Project & GAStech
Getting started with VAST
- Using p_load() of pacman package to load the required libraries
- Importing data
MC1 <- fromJSON("data/MC1.json")Create Tibble Dataframe
MC1_nodes <-as_tibble(MC1$nodes) %>%
  select(id,type, country)
MC1_edges <-as_tibble(MC1$links) %>%
select(source,target,type,weight,key)Getting started with GAStech
- Using p_load() of pacman package to load the required libraries
pacman::p_load(igraph, tidygraph, ggraph,
               visNetwork, lubridate, clock,
tidyverse, graphlayouts)- Importing data
GAStech_nodes <- read_csv("data/GAStech_email_node.csv")
GAStech_edges <- read_csv("data/GAStech_email_edge-v2.csv")
Refer to Hands-on Exercise 5
- Wrangling Time
GAStech_edges <- GAStech_edges %>%
  mutate(SendDate = dmy(SentDate)) %>%
  mutate(Weekday = wday(SentDate,
                        label = TRUE,
abbr = FALSE))- Wrangling attributes
GAStech_edges_aggregated <- GAStech_edges %>%
  filter(MainSubject == "Work related") %>%
  group_by(source, target, Weekday) %>%
    summarise(Weight = n()) %>%
  filter(source!=target) %>%
  filter(Weight > 1) %>%
ungroup()- Using
tbl_graph()to build tidygraph data model
GAStech_graph <- tbl_graph(nodes = GAStech_nodes,
                           edges = GAStech_edges_aggregated,
                           directed = TRUE)

GAStech_graph
# A tbl_graph: 54 nodes and 1372 edges
#
# A directed multigraph with 1 component
#
# A tibble: 54 × 4
id label Department Title
<dbl> <chr> <chr> <chr>
1 1 Mat.Bramar Administration Assistant to CEO
2 2 Anda.Ribera Administration Assistant to CFO
3 3 Rachel.Pantanal Administration Assistant to CIO
4 4 Linda.Lagos Administration Assistant to COO
5 5 Ruscella.Mies.Haber Administration Assistant to Engineering Group Manag…
6 6 Carla.Forluniau Administration Assistant to IT Group Manager
# ℹ 48 more rows
#
# A tibble: 1,372 × 4
from to Weekday Weight
<int> <int> <ord> <int>
1 1 2 Sunday 5
2 1 2 Monday 2
3 1 2 Tuesday 3
# ℹ 1,369 more rows- Changing the active object
GAStech_graph %>%
  activate(edges) %>%
  arrange(desc(Weight))
# A tbl_graph: 54 nodes and 1372 edges
#
# A directed multigraph with 1 component
#
# A tibble: 1,372 × 4
from to Weekday Weight
<int> <int> <ord> <int>
1 40 41 Saturday 13
2 41 43 Monday 11
3 35 31 Tuesday 10
4 40 41 Monday 10
5 40 43 Monday 10
6 36 32 Sunday 9
# ℹ 1,366 more rows
#
# A tibble: 54 × 4
id label Department Title
<dbl> <chr> <chr> <chr>
1 1 Mat.Bramar Administration Assistant to CEO
2 2 Anda.Ribera Administration Assistant to CFO
3 3 Rachel.Pantanal Administration Assistant to CIO
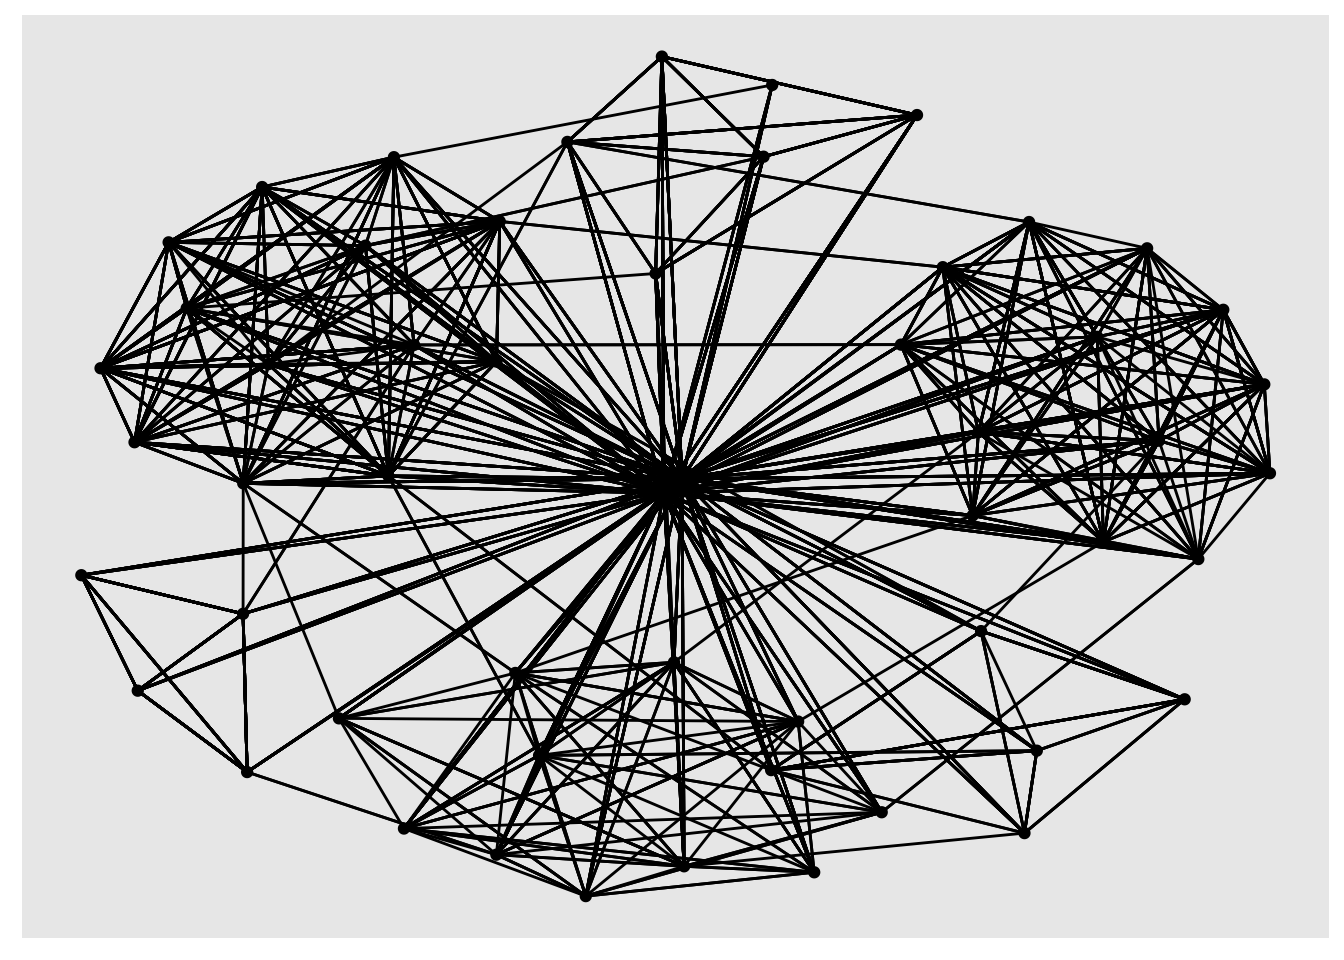
# ℹ 51 more rows- Plotting basic network graph
ggraph(GAStech_graph) +
  geom_edge_link() +
  geom_node_point()